Note
Go to the end to download the full example code.
Sparse Matrices
Sparse matrices in applied topology present several challenges.
They are often large, consuming huge amounts of memory.
They are indexed by simplices, cubes, of other objects, rather than integers
They have a variety of different coefficient rings
This tutorial introduces some highly effective OAT tools to meet these challenges. We will focus on the boundary matrix of a Vietoris-Rips complex for illustration, but many of the methods carry over to different types of sparse matrix offered by OAT.
import oat_python as oat

from fractions import Fraction
import numpy as np
import pandas as pd
import plotly.graph_objects as go
Vietoris Rips Complex
Create a Vietoris-Rips complex from a points of points
points                      =   np.random.rand(5, 3)
dissimilarity_matrix        =   oat.dissimilarity.sparse_matrix_for_points(points, max_dissimilarity=np.inf)
vietoris_rips               =   oat.core.vietoris_rips.VietorisRipsComplex(dissimilarity_matrix)
Simplices
List all simplices in a given dimension(s)
vietoris_rips.simplices_for_dimensions(dimensions=[0,1])
Look up a simplex’s filtration value
vietoris_rips.filtration_value(simplex=[0, 1, 2])
0.8777684218544266
An error is returned if the simplex is not in the complex, or if it is not formatted as a strictly ascending sequence of nonnegative integers
try:
    vietoris_rips.filtration_value(simplex=(0, 0,))
except Exception as e:
    print(f"Error: {e}")

try:
    vietoris_rips.filtration_value(simplex=(1, 0))
except Exception as e:
    print(f"Error: {e}")

try:
    vietoris_rips.filtration_value(simplex=(0,100))
except Exception as e:
    print(f"Error: {e}")

try:
    vietoris_rips.filtration_value(simplex=(-1,))
except Exception as e:
    print(f"Error: {e}")
Error: Simplex [0, 0] is not strictly sorted.
Error: Simplex [1, 0] is not strictly sorted.
Error: The input [0, 100] is not a valid simplex in this Vietoris-Rips complex.
Error: out of range integral type conversion attempted
Boundary matrix oracle (memory light)
We begin by creating a boundary matrix oracle.
To conserve memory, this object stores only a copy of the dissimilarity matrix in memory, and computes computes rows, columns, and entries of the boundary matrix on demand.
boundary_matrix_oracle = vietoris_rips.boundary_matrix_oracle()
Rows and columns
boundary_matrix_oracle.row_for_simplex([0,1])
boundary_matrix_oracle.column_for_simplex([0,1])
Entries
Look up an entry
boundary_matrix_oracle.entry_for_row_and_column(
    row_simplex=(0,1),
    column_simplex=(0,1,2)
)
Fraction(1, 1)
Keywords don’t have to be explicit
boundary_matrix_oracle.entry_for_row_and_column(
    [0,1],
    [0,1,2]
)
Fraction(1, 1)
Boundaries and coboundaries
Define a vector as a linear combination of simplices
vector = {
    "simplex": [(0,), (1,), (0, 1), (1, 2)],
    "coefficient": [Fraction(1, 2), Fraction(-3, 4), Fraction(2, 3), Fraction(5, 6)]
}

vector = pd.DataFrame(vector)
vector
Multiply the vector with the boundary matrix as a column vector (i.e. compute the boundary)
boundary_matrix_oracle.boundary_for_chain(vector)
Multiply the vector with the boundary matrix as a row vector (i.e. compute the coboundary)
boundary_matrix_oracle.coboundary_for_cochain(vector)
Row and column numbers
Boundary matrices are naturally indexed by simplices, not but row/column numbers. However, it’s common to represent submatrices of the boundary matrix with numbered rows and columns. OAT offers a tool to help translate between simplices and numbers.
Assign submatrix row and column numbers
Initialize the index tool with no row or column indices
submatrix_index_tool        =   vietoris_rips.submatrix_index_tool()

oat.plot.display_dataframes_side_by_side(
    submatrix_index_tool.row_indices(),
    submatrix_index_tool.column_indices(),
    titles=["Row indices", "Column indices"]
)
Provide custom lists of row and column indices
submatrix_index_tool.set_row_indices([(0,1), (1,2),])
submatrix_index_tool.set_column_indices([(0,1,2), (0,1,3)])

oat.plot.display_dataframes_side_by_side(
    submatrix_index_tool.row_indices(),
    submatrix_index_tool.column_indices(),
    titles=["Row indices", "Column indices"]
)
An error will be returned if the list of row (respectively) column indices contains duplicate entries.
try:
    submatrix_index_tool.set_row_indices([(0,1), (0,1)])
except Exception as e:
    print(f"Error: {e}")
Error: User-provided indices include one or more duplicates, including WeightedSimplex { weight: OrderedFloat(0.8777684218544266), vertices: [0, 1] }.
Select indices by simplex dimension
Indexing is managed by this submatrix_index_tool
submatrix_index_tool        =   vietoris_rips.submatrix_index_tool(
                                    row_dimensions=[0, 1],
                                    column_dimensions=[1,2],
                                )

print("\nThe first few row indices:")
submatrix_index_tool.row_indices().head()
The first few row indices:
Translate simplices and row/column numbers
Look up the column number for a simplex
column_number   =   submatrix_index_tool.submatrix_column_number_for_simplex([1,2,3])
column_number
12
Look up the simplex for a column number
weighted_simplex = submatrix_index_tool.weighted_simplex_for_submatrix_column_number( column_number )
weighted_simplex
<WeightedSimplex simplex=[1, 2, 3] | weight=0.830129>
The WeightedSimplex object is just a wrapper around the simplex and the weight
print(weighted_simplex)
print(weighted_simplex.simplex())
print(weighted_simplex.weight())
Simplex: (1, 2, 3)   Weight: 0.830129
(1, 2, 3)
0.830129490771365
Convert column vector types
column_vector      =    boundary_matrix_oracle.column_for_simplex([0,1,2])
dense_array        =    submatrix_index_tool.dense_array_for_column_vector_dataframe(column_vector)
column_vector
dense_array
array([Fraction(0, 1), Fraction(0, 1), Fraction(0, 1), Fraction(0, 1),
       Fraction(0, 1), Fraction(-1, 1), Fraction(0, 1), Fraction(0, 1),
       Fraction(0, 1), Fraction(0, 1), Fraction(1, 1), Fraction(0, 1),
       Fraction(1, 1), Fraction(0, 1), Fraction(0, 1)], dtype=object)
Reconstruct the original column vector
reconstructed_column_vector = submatrix_index_tool.column_vector_dataframe_for_dense_array(dense_array)
column_vector.equals(reconstructed_column_vector)
True
Convert row vector types
row_vector         =    boundary_matrix_oracle.row_for_simplex([0,1])
dense_array        =    submatrix_index_tool.dense_array_for_row_vector_dataframe(row_vector)
row_vector
dense_array
array([Fraction(0, 1), Fraction(0, 1), Fraction(0, 1), Fraction(0, 1),
       Fraction(0, 1), Fraction(0, 1), Fraction(0, 1), Fraction(0, 1),
       Fraction(0, 1), Fraction(0, 1), Fraction(0, 1), Fraction(0, 1),
       Fraction(0, 1), Fraction(0, 1), Fraction(1, 1), Fraction(1, 1),
       Fraction(0, 1), Fraction(1, 1), Fraction(0, 1), Fraction(0, 1)],
      dtype=object)
Reconstruct the original column vector
reconstructed_row_vector = submatrix_index_tool.row_vector_dataframe_for_dense_array(dense_array)
row_vector.equals(reconstructed_row_vector)
True
Common Python (sparse) matrix formats
OAT offers convenient tools to export submatrices to common formats. The first step is specifying which rows and columns you want to export to this format. We do this with a SubmatrixIndexTool, which also provides a number of convenient methods for mapping between simplices and row/column numbers. See the tutorial on Vietoris Rips boundary matrices for more details.
SciPy sparse matrix: CSR format
submatrix = boundary_matrix_oracle.write_submatrix_to_csr( submatrix_index_tool )
submatrix
<15x20 sparse matrix of type '<class 'numpy.float64'>'
    with 50 stored elements in Compressed Sparse Row format>
SciPy sparse matrix: (row,column,coefficient) triplet format
get a list of the nonzero triplets
sparse_coo              =   submatrix.tocoo() # convert to COOrdinate format
list(zip(sparse_coo.row, sparse_coo.col, sparse_coo.data)) # zip the row, column, and data arrays together to get a list of (row, column, value) triplets
[(0, 0, -1.0), (0, 7, -1.0), (0, 8, -1.0), (0, 9, -1.0), (1, 2, -1.0), (1, 3, -1.0), (1, 5, -1.0), (1, 7, 1.0), (2, 0, 1.0), (2, 1, -1.0), (2, 5, 1.0), (2, 6, -1.0), (3, 3, 1.0), (3, 4, -1.0), (3, 6, 1.0), (3, 8, 1.0), (4, 1, 1.0), (4, 2, 1.0), (4, 4, 1.0), (4, 9, 1.0), (5, 14, -1.0), (5, 16, 1.0), (5, 18, 1.0), (6, 11, 1.0), (6, 13, -1.0), (6, 18, 1.0), (7, 10, -1.0), (7, 11, -1.0), (7, 17, 1.0), (8, 10, 1.0), (8, 12, -1.0), (8, 15, 1.0), (9, 10, 1.0), (9, 13, 1.0), (9, 19, 1.0), (10, 11, 1.0), (10, 12, 1.0), (10, 14, 1.0), (11, 12, 1.0), (11, 13, 1.0), (11, 16, 1.0), (12, 14, 1.0), (12, 15, 1.0), (12, 17, 1.0), (13, 15, -1.0), (13, 16, -1.0), (13, 19, 1.0), (14, 17, -1.0), (14, 18, -1.0), (14, 19, -1.0)]
Dense numpy array
print a dense version of the matrix
submatrix.todense()
matrix([[-1.,  0.,  0.,  0.,  0.,  0.,  0., -1., -1., -1.,  0.,  0.,  0.,
          0.,  0.,  0.,  0.,  0.,  0.,  0.],
        [ 0.,  0., -1., -1.,  0., -1.,  0.,  1.,  0.,  0.,  0.,  0.,  0.,
          0.,  0.,  0.,  0.,  0.,  0.,  0.],
        [ 1., -1.,  0.,  0.,  0.,  1., -1.,  0.,  0.,  0.,  0.,  0.,  0.,
          0.,  0.,  0.,  0.,  0.,  0.,  0.],
        [ 0.,  0.,  0.,  1., -1.,  0.,  1.,  0.,  1.,  0.,  0.,  0.,  0.,
          0.,  0.,  0.,  0.,  0.,  0.,  0.],
        [ 0.,  1.,  1.,  0.,  1.,  0.,  0.,  0.,  0.,  1.,  0.,  0.,  0.,
          0.,  0.,  0.,  0.,  0.,  0.,  0.],
        [ 0.,  0.,  0.,  0.,  0.,  0.,  0.,  0.,  0.,  0.,  0.,  0.,  0.,
          0., -1.,  0.,  1.,  0.,  1.,  0.],
        [ 0.,  0.,  0.,  0.,  0.,  0.,  0.,  0.,  0.,  0.,  0.,  1.,  0.,
         -1.,  0.,  0.,  0.,  0.,  1.,  0.],
        [ 0.,  0.,  0.,  0.,  0.,  0.,  0.,  0.,  0.,  0., -1., -1.,  0.,
          0.,  0.,  0.,  0.,  1.,  0.,  0.],
        [ 0.,  0.,  0.,  0.,  0.,  0.,  0.,  0.,  0.,  0.,  1.,  0., -1.,
          0.,  0.,  1.,  0.,  0.,  0.,  0.],
        [ 0.,  0.,  0.,  0.,  0.,  0.,  0.,  0.,  0.,  0.,  1.,  0.,  0.,
          1.,  0.,  0.,  0.,  0.,  0.,  1.],
        [ 0.,  0.,  0.,  0.,  0.,  0.,  0.,  0.,  0.,  0.,  0.,  1.,  1.,
          0.,  1.,  0.,  0.,  0.,  0.,  0.],
        [ 0.,  0.,  0.,  0.,  0.,  0.,  0.,  0.,  0.,  0.,  0.,  0.,  1.,
          1.,  0.,  0.,  1.,  0.,  0.,  0.],
        [ 0.,  0.,  0.,  0.,  0.,  0.,  0.,  0.,  0.,  0.,  0.,  0.,  0.,
          0.,  1.,  1.,  0.,  1.,  0.,  0.],
        [ 0.,  0.,  0.,  0.,  0.,  0.,  0.,  0.,  0.,  0.,  0.,  0.,  0.,
          0.,  0., -1., -1.,  0.,  0.,  1.],
        [ 0.,  0.,  0.,  0.,  0.,  0.,  0.,  0.,  0.,  0.,  0.,  0.,  0.,
          0.,  0.,  0.,  0., -1., -1., -1.]])
Sparse dataframe
you can use the the submatrix_index_tool to export a CSR matrix to a sparse pandas DataFrame with labeled rows and column
submatrix_index_tool.sparse_dataframe_for_csr_matrix(submatrix)
this method is identical to calling the following:
df              =   pd.DataFrame.sparse.from_spmatrix(
                        submatrix,
                        index=submatrix_index_tool.row_indices().simplex.tolist(),
                        columns=submatrix_index_tool.column_indices().simplex,
                    )
df
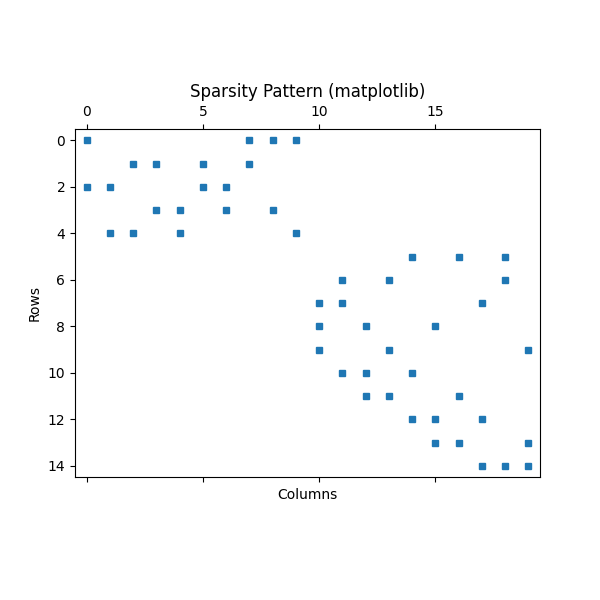
Matplotlib scatter
import matplotlib.pyplot as plt

# Suppose `csr` is your scipy.sparse.csr_matrix
plt.figure(figsize=(6, 6))
plt.spy(submatrix, markersize=5)
plt.title("Sparsity Pattern (matplotlib)")
plt.xlabel("Columns")
plt.ylabel("Rows")
plt.show()
Plotly
# points: your scipy.sparse.coo_matrix
# row_labels: list of row labels (length = points.shape[0])
# col_labels: list of column labels (length = points.shape[1])

points = submatrix.tocoo()

row_labels = submatrix_index_tool.row_indices().simplex.tolist()
col_labels = submatrix_index_tool.column_indices().simplex.tolist()
hover_text = [
    f"row: {row_labels[r]}<br>column: {col_labels[c]}<br>coefficient: {v}"
    for r, c, v in zip(points.row, points.col, points.data)
]

fig = go.Figure(go.Scattergl(
    x=points.col,
    y=points.row,
    mode='markers',
    marker=dict(size=4),
    text=hover_text,
    hoverinfo="text"
))

fig.update_layout(
    title="Hover over points to see row/column/coefficient!",
    xaxis_title="Columns",
    yaxis_title="Rows",
    xaxis=dict(
        tickmode='array',
        tickvals=list(range(len(col_labels))),
        ticktext=[str(label) for label in col_labels]
    ),
    yaxis=dict(
        tickmode='array',
        tickvals=list(range(len(row_labels))),
        ticktext=[str(label) for label in row_labels],
        autorange='reversed'
    ),
    width=1200,
    height=800
)

fig
Total running time of the script: (0 minutes 0.109 seconds)